Dubrovnik Visitors
Live visitor numbers and crowd forecasts for a UNESCO World Heritage old town
- Client
- City of Dubrovnik
- Platforms
- Web, Embeddable widget, API
- What we did
- Product design, Web development, IoT and sensor integration, Machine learning, Hosting and support
The challenge
Dubrovnik's Old Town is a UNESCO World Heritage site and one of the most visited places in the Mediterranean. Its carrying capacity study puts the upper limit at 11,275 people at once, with moderate tolerance. To manage that, the city first has to know how many people are inside, right now and in the days ahead.
The numbers had to be reliable enough for city officials to act on, and simple enough for residents and visitors to use when they decide when to come.
What we built
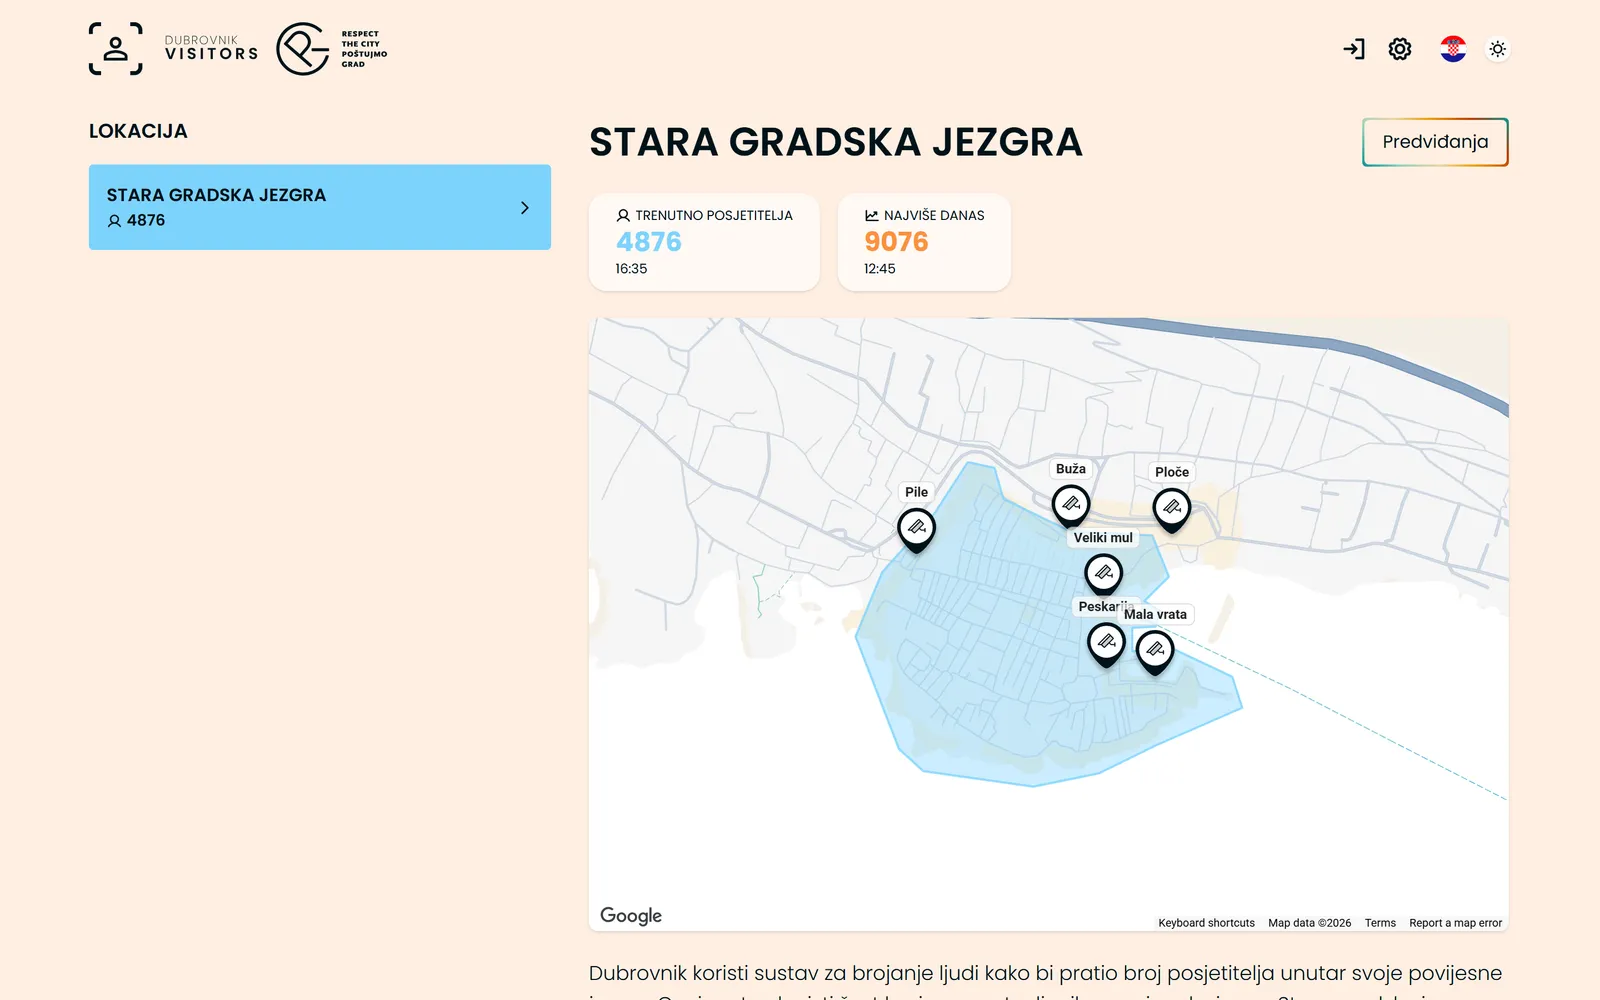
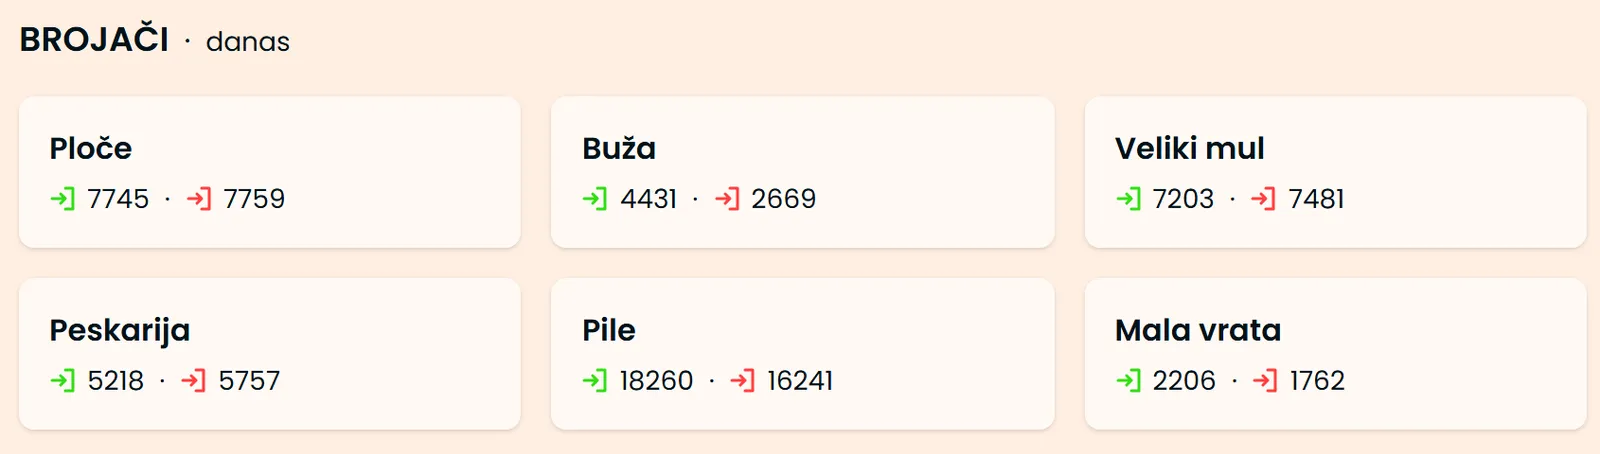
We built Dubrovnik Visitors, part of the city's Respect the City programme. Camera-based counters at the six entrances (Pile, Ploče, Buža, Veliki mul, Peskarija and Mala vrata) count everyone who comes in and goes out. The platform collects the readings every 15 minutes, shows the live total on a map, and keeps the history for analysis.
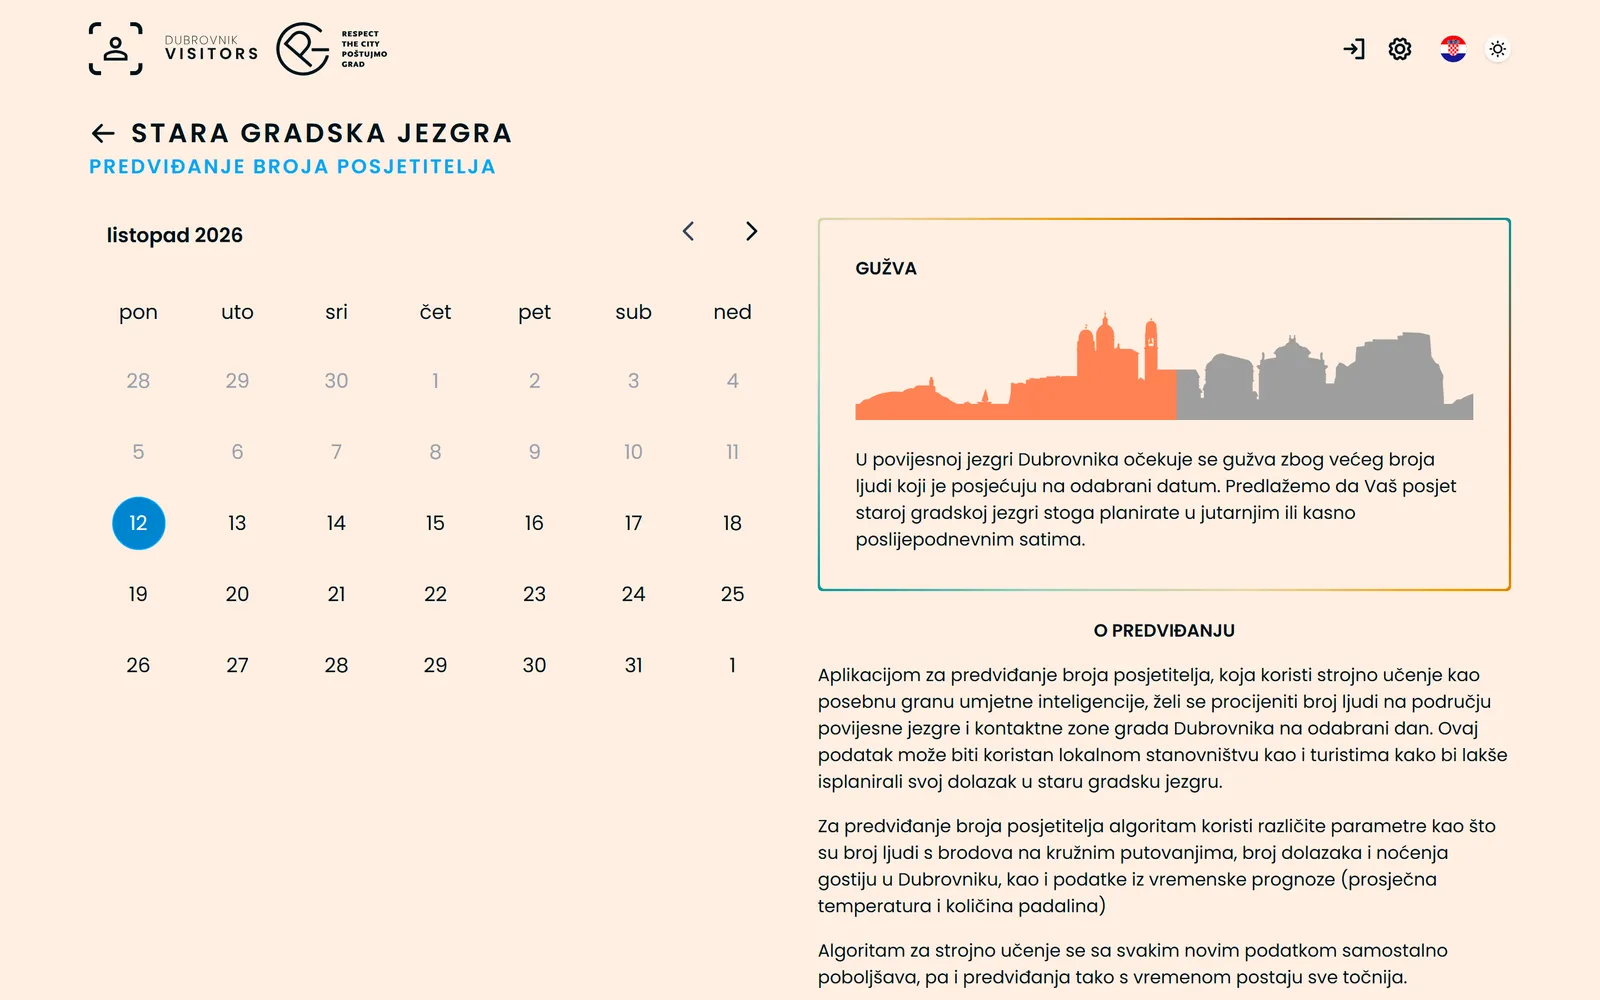
A forecasting model, trained on cruise ship passengers, tourist arrivals and overnight stays, and the weather forecast, estimates the crowds for any chosen day and suggests the best time to visit. It gets more accurate with every new day of data.
How it works
Six gates, one number
Counters at the six entrances count everyone who comes in and goes out. Every 15 minutes the readings add up to the number of people inside the Old Town, measured against its carrying capacity.
Every gate counts
Camera-based counters at Pile, Ploče, Buža, Veliki mul, Peskarija and Mala vrata count entries and exits.
A reading every 15 minutes
The platform collects the counts, works out how many people are inside and keeps the history.
One number for everyone
The city, residents and visitors see the live total and today's peak, against a carrying capacity of 11,275 people.
Key features
Live count, every gate
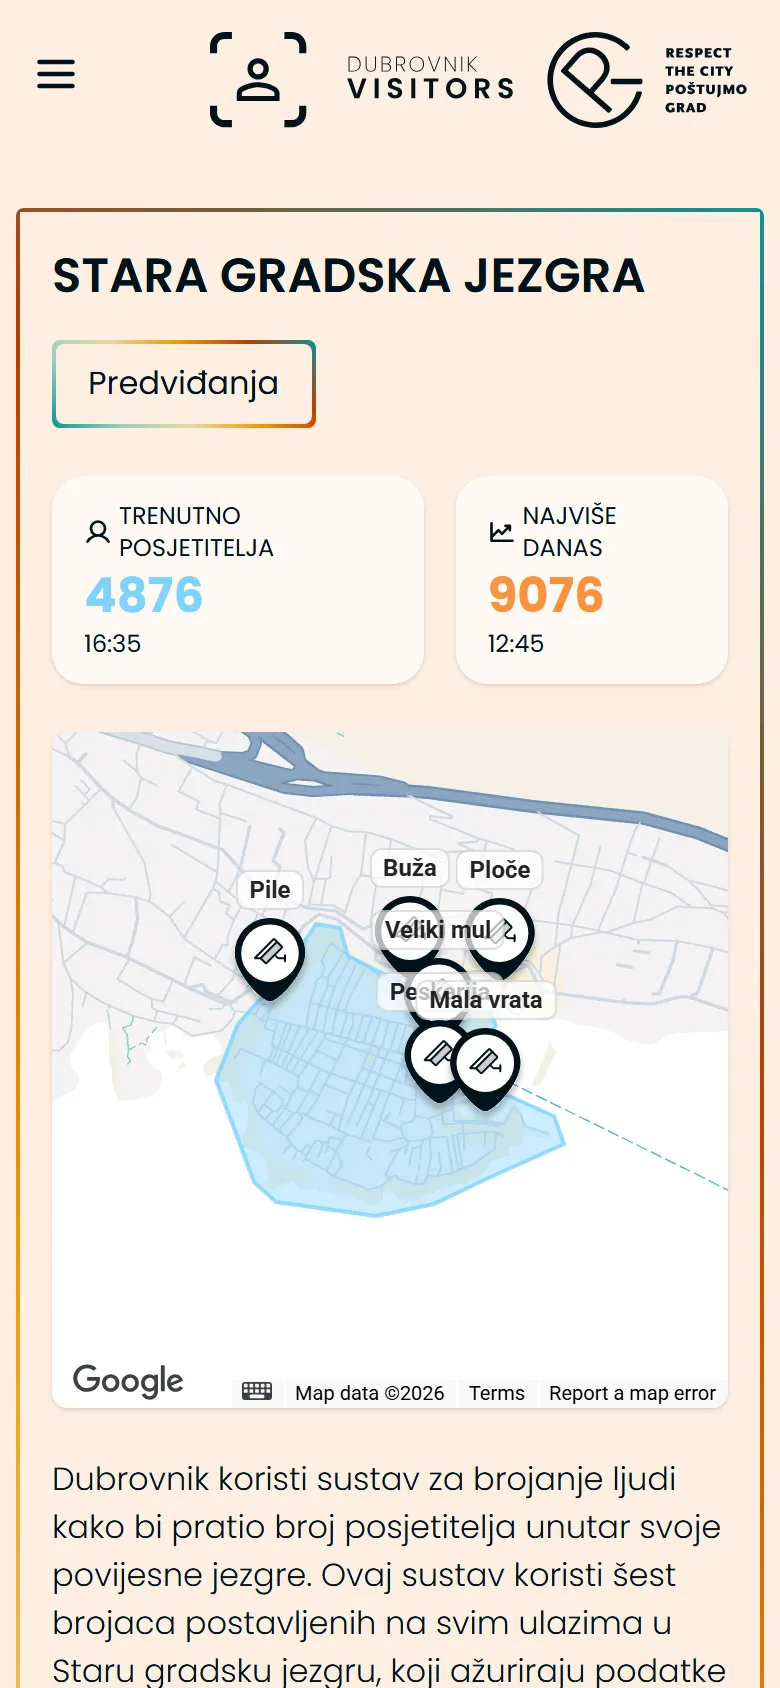
Entries and exits per gate, the current total, today's peak and a daily chart, on a map of the Old Town.
Crowd forecast calendar
Pick a day and see the expected crowd, with advice on when to come. Built for residents and visitors alike.
Machine learning
Models run inside the platform with ONNX. Besides visitor numbers, they forecast peak heat and humidity for selected areas.
Sensors and data sources
Hikvision people counting cameras, Cisco Meraki Wi-Fi presence data and OpenWeather forecasts, brought together in one place.
Monitoring and alerts
If a counter goes offline, the team is e-mailed with the gate and the time it stopped, so gaps in the data are fixed fast.
Open to partners
An API with keys for partners, data export, and a widget other sites can embed. In Croatian and English, light and dark theme.
Screens
What it changed
- The city sees in real time how full the Old Town is, measured against its carrying capacity.
- Visitors and residents can plan their visit around the crowds.
- Years of data for decisions on cruise schedules, events and city services.
Technology
- Angular
- ASP.NET Core
- SQL Server
- ML.NET + ONNX
- Chart.js
- Google Maps
- Hikvision
- Cisco Meraki
- OpenWeather